
As many as 1,629 cases of corruption were reported in India–in which 9,960 people were involved or 11 every day–under the Prevention of Corruption Act, 1988, over two-and-half years ending June 30 2017, according to this reply to the Rajya Sabha (upper house of Parliament) on August 10, 2017.

Of 9,960 people involved in the cases, 6,023 or 60% were private persons/citizens, 3,896 or 39% were public servants and 41 were politicians, data show.
Corruption cases registered increased by almost 10% from 617 in 2015 to 673 in 2016. As many as 339 cases were registered during the first six months of 2017.

Source: Rajya Sabha
As many as 2,303 people–almost three every day–were convicted for corruption under the Prevention of Corruption Act, 1988, over two-and-half years ending June 30, 2017. Of the persons convicted, 59% or 1,356 were public servants, 41% or 943 were private citizens and four politicians.

Source: Rajya Sabha
Cases that ended in convictions increased 16% from 434 in 2015 to 503 in 2016. During the first six months of 2017, 199 such cases ended in a conviction, data show.
As many as 6,414 corruption cases under trial were pending as of June 30, 2017, involving 35,770 people that includes 18,780 citizens, 16,875 public servants and 115 politicians. Pending cases have come down from 6,663 in 2015 to 6,414 as of June 30, 2017.
As many as 850 corruption cases are under investigation by the Central Bureau of Investigation, of which 14 are “gathering dust for over five years”, the Central Vigilance Commission said, India Today reported on October 26, 2017.
India fares poorly on corruption perception index, ranks 79 of 176 countries
India was ranked 79 of 176 countries, scoring 40 on the “Corruption Perception Index 2016” released in January 2017, by Transparency International, a global advocacy on corruption.
Denmark and New Zealand topped the list scoring 90 each, followed by Finland. The global average score was 43.
India dropped three ranks in 2016 over 2015 from 76 of 167 countries in 2015 and 85 of 174 countries in 2014.
Among BRICS countries, South Africa performed better and was ranked 64 in 2016; India, China and Brazil were ranked 79, followed by Russia ranking the lowest (131).
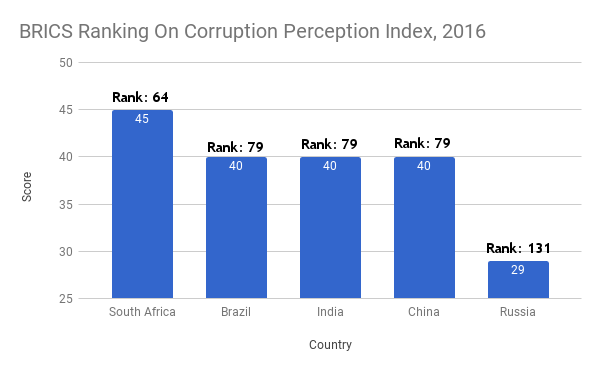
Source: Transparency International
India’s poor performance is attributed to the inability to tackle small corruption cases as well as large scandals, the Transparency International report said. “The impact of corruption on poverty, illiteracy and police brutality shows that not only the economy is growing – but also inequality.”
(Mallapur is an analyst with IndiaSpend.)
Courtesy: India Spend