
The top 1% of the population in India holds 40% of the wealth, making the country one of the most unequal in the world, according to the 2026 World Inequality Report, released on Wednesday, also International Human Rights Day, December 10.
The study’s findings–published by the World Inequality Lab–also found that this wealth inequality in India has shown no signs of reduction in recent years. The richest 10% hold about 65% of the total wealth, and the top 1% about 40%, the report said.
In terms of income inequality, the top 10% of earners receive about 58% of national income, it said. The bottom 50% get only 15%. The income gap between the top 10% and the bottom 50% remained stable between 2014 and 2024, according to the report.
The average annual income in India was about 6,200 euros, or Rs 6.49 lakh approximately, per capita on a purchasing power parity basis. Purchasing power parity is an economic tool that compares the value of different currencies by measuring what the same amount of money can buy in different countries. The average wealth stands at about 28,000 euros on a purchasing power parity basis.
The female labour participation was “very low” at 15.7% and had shown no improvement over the past decade, the report said.
“Overall, inequality in India remains deeply entrenched across income, wealth and gender dimensions, highlighting persistent structural divides within the economy,” it added.
Inequality outlook for India. Source: World Inequality Report 2026
Global trends
Globally, wealth has reached historic highs, but remains, like India, “very unevenly distributed”, the report said. The report noted that the top 0.001%, which is fewer than 60,000 multimillionaires, owns three times more wealth than the entire bottom 50% of humans put together.
Within almost every region of the world, the top 1% alone hold more wealth than the bottom 90% combined, it added. The report added that the global financial system continues to be rigged in favour of the rich countries. Ricardo Gómez-Carrera, the lead author of the report, stated that inequality is “silent until it becomes scandalous”.
“This report gives voice to inequality – and to the billions of people whose opportunities are frustrated by today’s unequal social and economic structures,” Gómez-Carrera added.
The World Inequality Report was launched in 2018. Third edition, published on Wednesday, was released in the context of South Africa’s presidency of the Group of 20 in November, which highlighted two crises: the explosion of global inequalities and the weakening of multilateralism, the analysis said.
The report explores the new dimensions of inequality defining the 21st century, such as climate, gender inequalities, unequal access to human capital, asymmetries in the global financial system and territorial divides that are reshaping democracies.
Figure 2.7 provides a geographic breakdown of global income groups in 1980 and 2025, highlighting how the composition of top earners and other groups has shifted over time. In 1980, the global elite was overwhelmingly concentrated in North America & Oceania and Europe, which together accounted for most of the world’s top income groups. Latin America also had some presence near the top, but China and India were almost entirely confined to the bottom half of the distribution. At that time, China had virtually no presence among the global elite, while India, Asia in general, and Sub-Saharan Africa were heavily concentrated in the very lowest percentiles.
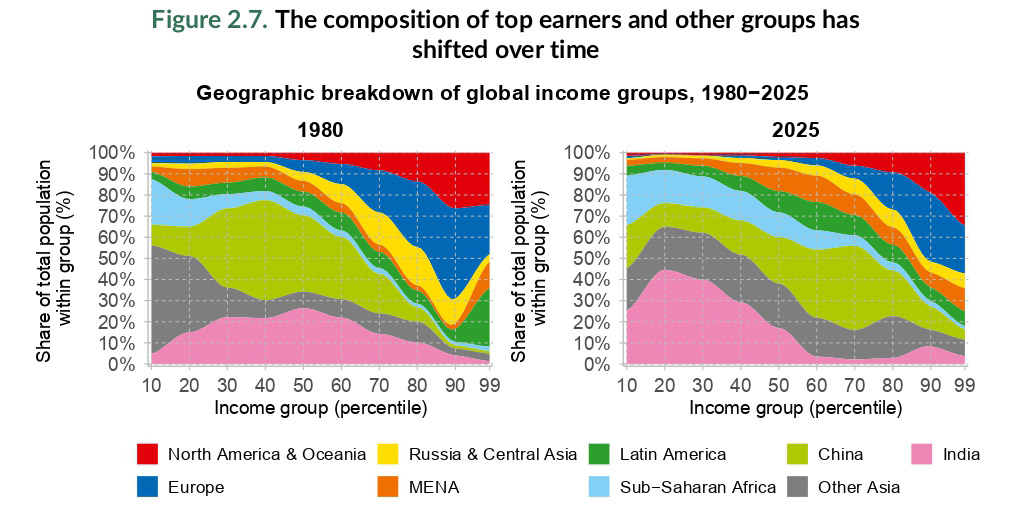
Interpretation. These graphs show the geographical breakdown of global income groups. Between 1980 and 2025, the global income distribution has shifted, with China gaining presence in the middle and upper−middle percentiles, while Europe and North America & Oceania’s dominance in top income groups has declined, but it is still large. In 1980, 1% of the world’s top 1% income group were Chinese residents. By 2025, this figure increased to 5%. This highlights the growing global share of China and the diversification of the global elite.
Sources and series: Chancel et al. (2022) and wir2026.wid.world/methodology.
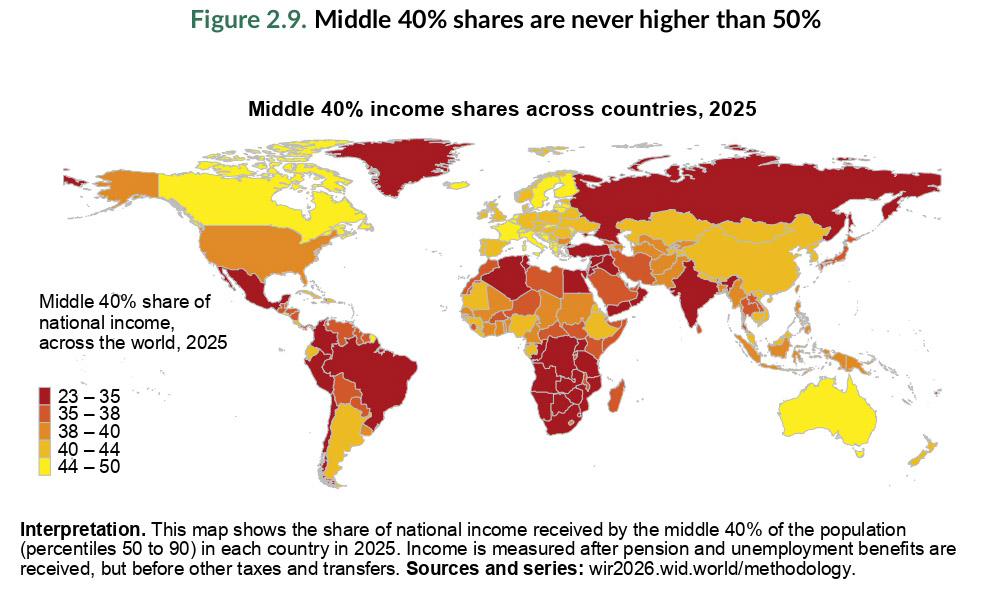
Figure 2.9 turns to the middle 40%, often considered the backbone of the middle class. Here the contrasts are equally stark. In the most unequal settings, especially in Latin America and parts of Africa, the middle 40% receive as little as 23–35% of income, reflecting a fragile middle class. By contrast, in Europe and parts of North America & Oceania, this group’s share rises to 44–50%, making them central to national income distribution. Asia shows both ends of the spectrum: India’s middle 40% remains in the lower levels, while China’s earns a larger share.
Related:
One percent of Indians own 58% of country’s wealth: Oxfam inequality report
Journalist cannot cover the labour beat without questioning extreme inequality- P Sainath
Tax Justice proposal: what are leading economists proposing on Wealth Redistribution in India