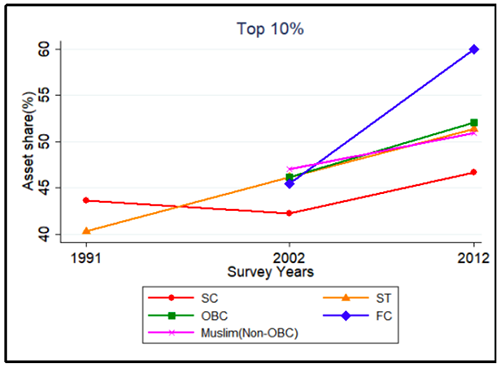
Bengaluru: Although India’s upper caste households earned nearly 47% more than the national average annual household income, the top 10% within these castes owned 60% of the wealth within the group in 2012, as per a recent paper by the World Inequality Database.

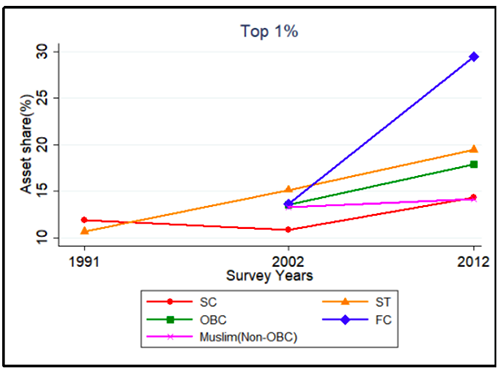
Further, the wealthiest 1% among them grew their wealth by nearly 16 percentage points to 29.4% over the decade to 2012, the paper, entitled ‘Wealth Inequality, Class and Caste in India, 1961-2012’ and published in November 2018, said.
The vast inequality of income and wealth between and within castes highlighted in the paper are significant in the light of the Bharatiya Janata Party government’s new bill to entitle poorer sections among the forward castes to a 10% quota in government jobs and higher education institutions, which has been challenged in court.
Not only is the wealth and income gap large, it is growing–across all castes, in the 36 years till 2016, the share of wealth held by the top 10% has increased 24 percentage points to 55%, as IndiaSpend reported on January 2, 2019.
Inequality between castes
Marginalised caste groups such as the scheduled castes (SCs), scheduled tribes (STs) and other backward castes (OBCs) earn much less than the national household income average of Rs 113,222, according to the paper. SC and ST households earn 21% and 34%, respectively, less than the national average. OBC households fare better but still earn 8% or Rs 9,123 less than the annual Indian average.
Among upper caste groups, Brahmins earn 48% above the national average and non-Brahmin forward castes, 45%, said the paper, ‘Wealth Inequality, Class and Caste in India, 1961-2012’.
On January 9, 2019, the Indian parliament approved the Constitution (124th Amendment) Bill to provide 10% reservation in government jobs and higher education institutions for economically weaker sections of the general category of citizens. These are families that do not belong to SC, ST or OBC categories, and earn less than Rs 800,000 annually, own less than 5 hectares of agricultural land and own residential properties smaller than 1,000 sq.ft.


Based on the World Inequality Database, the paper combined data from wealth surveys, the National Sample Survey-All India Debt and Investment Survey (NSS-AIDIS), and millionaire lists. It used the censuses, the NSS-AIDIS and the Indian Human Development survey to explore the evolving relationship between class and caste in India.
“Economic ranking follows caste hierarchy, making caste a valid stratification in the society,” the paper noted. “It is important to keep in mind that the standard deviation is also very high in FC groups, i.e. not all are well off in that group. The clustering of social groups in (sic) not perfect.”
Within castes, the highest differences are among forward castes–and growing–and the least wealth differences are to be found among SCs.
“Caste and class are largely co-terminus with few exceptions and life-chances in India continue to be based on one’s caste position,” A.R. Vasavi, a social anthropologist and independent researcher, told IndiaSpend. “From allocation of resources, to opportunities, to social capital the distribution pattern matches the skewed social structure; those higher in the ranking gain or get better allocations at the cost of denying the majority.”
India is one of the most unequal countries in the world with the top 10% controlling 55% of the total wealth, up from 31% in 1980, according to the 2018 World Inequality report, as IndiaSpend reported on January 2, 2019.
The National Family Health Survey 2015-16 (NFHS-4) showed that 45.9% of ST population were in the lowest wealth bracket compared to 26.6% of SC population, 18.3% of OBCs, 9.7% of other castes and 25.3% of those whose caste is unknown, IndiaSpend reported on February 28, 2018.
Muslims have lower income than average, non-Hindu, non-Muslim groups have highest
Muslims, while faring better than the SC, ST and OBC population, reported an annual household income 7% less than the national average.
Others (non-Hindu, non-Muslim groups and those who do not fall under the SC, ST and OBC categories) were found to be the richest group, though they make for only 1.5% of the country’s population, the paper said. They earned an annual income of Rs 242,708, twice the annual household income average in India.

“Caste, kinship or family, either or all these can hamper economic progress if they impose restrictions,” Andre Beteille, professor emeritus, department of sociology at the University of Delhi, told IndiaSpend.
Compared to population, wealth held by SC and ST was low
Though SCs constitute nearly 18-20% of India’s population, the wealth they held was 11 percentage points less than their population share in 2012. In the case of STs, it was nearly 2 percentage points less than the community’s population share (9%), the paper shows.
“OBC group owned 32% of total wealth in 2002 which increased only marginally in 2012 resulting in overall worsening of the gap relative to population share (-7.8% to -10.2%), due to considerable increase in their population share,” the paper notes.
The forward caste group share has shown an increase from 39% to 41% in their share in total wealth and improved the gap from by 4 percentage points to 18%.
Wealth inequalities within castes, sharpest among forward castes
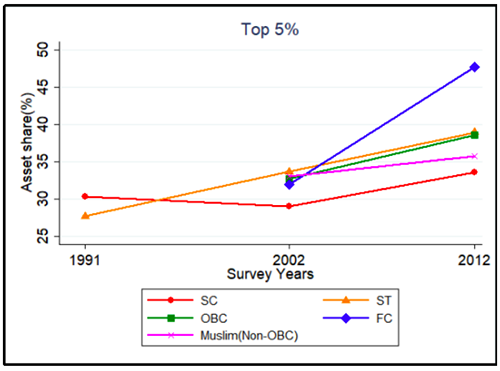
As mentioned earlier, the forward castes showed the highest (47.6%) increase in wealth among the top 5% of the three caste groups during the decade ending 2012. By 2012, the group’s top 10% owned 60% of the total forward caste wealth.
In the same decade, among the STs, the top 1% augmented the wealth they held by 4.4 percentage points to 19.5% while the top 1% of SCs had increased their wealth by 2.5 percentage points to 14.4% between 1991 and 2012.
Among the OBCs and STs too, the top 10% had cornered most of the wealth. The top 10% of both groups held around 52% of wealth in 2012 and the top 10% of SCs’ share increased three percentage points to 46.7% in two decades till 2012.
“In 2002, a person from the ST group needed 23 times more wealth to reach to top decile [1/10th] from the threshold of second decile,” it noted. “Similarly for SC, OBC, FC and Muslim one required 22, 32, 45 and 57 times respectively to enter into the 10th decile.”
Share Of Wealth In Top Decile Among FC, SC, ST and OBC


Source: Wealth Inequality, Class and Caste in India, 1961-2012 (November, 2018)
Note: Graph shows the wealth share in top 10%,5% and 1% within different caste groups.
While the exact magnitude of inequality within broad caste groups may vary across the country, a World Bank study on inequality between caste groups in rural Bihar suggests that inequality among sub-castes may be a key driver of economic inequality in India, Livemint reported on July 25, 2018.
Among SCs, for instance, Musahars are much worse off than Chamars and Dushadh (all three belong to castes traditionally engaged in tasks considered menial) in terms of both monthly consumption expenditure and educational attainment. Among OBCs, sub-castes such as Koeris fare badly compared with most Dalit sub-castes, Livemint noted. It did not offer any explanation for this.
“Bottom 50% of the population has lost 2-4 percentage points within all the caste categories. The major decline [has been in the] share in FC followed by ST, OBC and SC and Muslims,” the paper noted.
(Paliath is an analyst with IndiaSpend.)
Courtesy: India Spend
