

Background of HCES
The Household Consumption Expenditure Survey (HCES) conducted by the National Sample Survey Office (NSSO), and designed to collect information on consumption and expenditure of households on goods and services, was released by the Ministry of Statistics & Programme Implementation (MoSPI) in June 2024. Drawing from this data, a report ‘Nutritional Intake in India’ was released in July 2025.
The HCES estimates the monthly per capita consumption expenditure (MPCE) from the total value of monthly consumption of goods and services of the household divided by the number of members of the household, and its distribution among households and individuals. It gives a break up of expenditure by commodity group at the national and state level. It has two sets of estimates – one without factoring in the value of items (grains, edible oil, pulses, laptops or personal computers, bicycles, uniforms, footwear etc) received free of cost through various social welfare programmes, and the other with the imputed values that includes these items. Pradhan Mantri Jan Arogya Yojana (PM-JAY) and education related information has not been imputed here because of the apparent complexity of measurement.
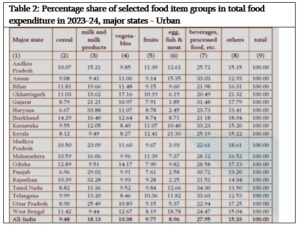
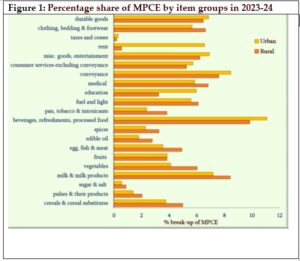
Proportion of expenditure on food in a household is considered as an indicator of poverty. A decline in food spending is generally understood as an increase in incomes, which then means having more money for other expenditures like on medical, clothing, education, conveyance, durables, fuel and entertainment, among other things. Food as a share of total consumer expenditure is less than 10% in many economies. In India, it continues to remain high overall. In rural households, the share of food in total consumption expenditure varies from 40% (Kerala) to 53% (Assam) (mean 47%), and in the urban households from 36% (Maharashtra) to 49% (Bihar) (mean 40%).
Based on the HCES, the government, through the NITI Aayog and other bodies, has declared that less than 5% of Indians are now expected to be below the poverty line, that welfare, inequality and poverty have improved since 2011-12, and that the nutritional intake is seen to have generally improved. Going forward, if policies have to be evidence-based, then all of these assertions have to be revisited.
Nutritional Intake Data
The report—‘Nutritional Intake in India’, estimates per capita and per consumer unit consumption of calories, protein, and fat. This report has apparently been compiled to ensure that adequate nutrition can be ensured for citizens, particularly those who are economically vulnerable, to plan welfare schemes and to compute poverty related calculations, for national and international comparisons. It gives an idea of nutrient intake and its source. It therefore gives an idea of the energy, protein and fat consumption of each household which can then be extrapolated to individuals. To date, five reports on “Nutrition Intake in India’ have been published[1].
Key findings on nutrition
As can be seen in Table 1 and 2, there is a similar pattern in expenditure on consumption of various categories of food items, the highest proportion being spent on consumption of beverages and processed food (21% in rural areas and 28% in urban areas).These changes in the composition of household expenditure are attributed to changes in household demand and improved infrastructure, storage, and transportation, which have expanded the markets for perishable items such as fresh fruits, milk & milk products, eggs, fish, and meat, making them more accessible and affordable across all regions of India.
The recorded foods consumed by the household are converted into the equivalent amounts of energy, protein and fat based on a Nutrition Conversion Table prepared by a committee constituted by MoSPI. households.
The intakes as per the report are:
Average Calorie Intake:
- Rural: 2,212 kcal
- Urban: 2,240 kcal
Protein (grams):
- Rural: 61.8
- Urban: 63.4
Fat (grams):
- Rural: 60.4
- Urban: 69.8
However, the actual intake of nutrients depends on how these foods are processed and/or cooked in the surveyed households.
For example, if a larger proportion of calories are derived from simple carbohydrates (all forms of sugar) or refined carbohydrates (grains, root vegetables and some pulses and legumes with the fibre and bran being removed) will quickly increase blood sugar levels. then it can lead to an increased risk of obesity and diabetes. Therefore calories from simple sugars and refined complex carbohydrates should be minimised or stopped. But merely computing the total number of calories without breaking them down into their source does not truly indicate the nutritive value of food consumed.
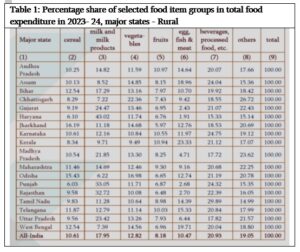
The urban and rural data for different states (Table 1 and 2), gives an idea of how different states facilitate different foods and dietary diversity. For instance, Kerala, West Bengal, Assam are among the top spenders on animal sources of protein while MP and Rajasthan are among the lowest. Similarly Haryana, MP, Rajasthan, Punjab are among the top spenders on milk and milk products while Kerala, West Bengal and Assam are among the lowest consumers of milk and milk products. These differences are related to geographical location, on what kinds of food is grown locally and is easily available.
For instance Kerala, West Bengal and Assam are close to large rivers and /or sea. Therefore fish consumption is very high. On the other hand, cattle and other livestock rearing is common in the Gangetic plains of North India. So Haryana, UP, Rajasthan and MP are among the top spenders for milk and milk products. Policy makers need to examine these data in the light of local contexts and should ensure that dietary diversity is at the heart of all welfare schemes related to food and nutrition such as the food and take home rations (THR) provided in anganwadis, public distribution system (PDS), mid-day meals and so on. Policy makers need to use these data to join the dots so that the schemes and programs are interconnected and comprehensive.
For example, consumption expenditure could be compared with data on the prevalence of anemia, stunting, underweight and other deficiencies. Such an exercise will contribute towards development of meaningful and effective programs that make use of local diversity in foods and also cater to the local tastes. Instead, the government chooses to take short cuts that benefit multi-national corporations such as universal fortification of rice with iron.
Energy/calories
The energy consumption of a man of average height and weight doing sedentary work is considered as one Consumption unit (CU) and equivalent to 2400 kcal. If the same man does moderate and heavy work, the CU would increase. Women and children are considered to have less CU than this average man. As per Table 3, the average daily per capita and per consumer unit intake of calorie protein and fat has not changed much between the previous survey (2022-23) and this (2023-24).
| Table 3: Average daily per capita and per consumer unit intake of calorie, protein and fat in 2022-23 & 2023-24: All-India | ||||||||
| Intake of | per capita per day | per consumer unit* per day | ||||||
| 2022-23 | 2023-24 | 2022-23 | 2023-24 | |||||
| Rural | Urban | Rural | Urban | Rural | Urban | Rural | Urban | |
| Calorie (Kcal) | 2233 | 2250 | 2212 | 2240 | 2407 | 2488 | 2383 | 2472 |
| Protein (gm) | 61.9 | 63.2 | 61.8 | 63.4 | 66.7 | 69.9 | 66.6 | 69.9 |
| Fat (gm) | 59.7 | 70.5 | 60.4 | 69.8 | 64.4 | 78.0 | 65.1 | 77.0 |
*Consumer unit is a unit used to measure the energy requirement of a group of persons of different sectors, gender and age-groups
The HCES assumes that animal products like milk, meat, fish and egg, and plant foods like pulses, oilseeds and nuts are all good sources of protein, but both these groups cannot be held at par. Plant based foods can be deficient in certain essential amino acids.
In the rural sector the share of cereals ranges between 34-55% in all major States across both periods except Kerala, where it is around 25-26%. In the urban sector the share of cereals is 24-25% in Kerala and 31-51% in all other major States.
Protein
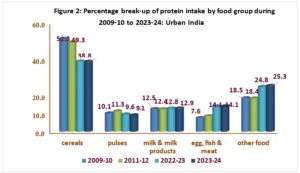
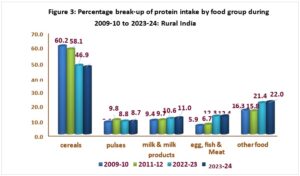
With regard to proteins, the report claims that cereals continue to be the single largest source of protein for households with a share of about 46-47% for rural India and about 39% for urban India, although their contribution to protein has come down and that from pulses, dairy and meat/fish/poultry going up.
As can be seen in Figures 2 and 3, most of the protein source are cheap quality from cereal, unlike the highly bioavailable animal source foods such as meat, milk and milk products, eggs, fish, poultry which contribute no more than 20% of the total intake in rural areas and 27% in urban areas. India, thus has a long way to go before it has access to the kind of proteins (and other nutrients) that enable the best possible heights and weights as also improvement of other nutritional indicators. Cereals are only a moderate source of protein as they contain about 10% protein. Rice contains less protein (7%) than wheat (approximately 10%) and other cereals. Leafy vegetables, fruits, roots, tubers are generally poor sources of protein as they contain less than 2% protein.
For instance, it is assumed in the report, that soya bean is the richest source of protein, however these proteins are incomplete, with poor bioavailability and being indigestible, requiring a lot of processing to improve digestibility. This processing can, however, contribute to denaturing of the proteins.
The other sources of proteins have poor bioavailability and calculations have to factor that in. It is also important to calculate intake in grams per kg body weight with due consideration for age, activity and physiological status.
Of the 20 amino acids that the body requires, it cannot synthesise 9 (essential) AA which must be consumed in the diet. The bioavailability (ability to utilise) is more from eggs, milk and meat. Proteins help to build and repair tissues. Usual recommended protein is 0.8 gm per kilogram body weight or 10-15% of total calories but some studies show that young children, adolescents, pregnant/lactating women and senior citizens may need more from 1.2 -1.7 gm/day. Even if you consume proteins from plant sources, at least 50% of total intake should come from animal sources (milk, dairy, eggs, meat, fish or chicken) or 50:50. If the ASF proportion drops (40 ASF: 60 PSF), chances of developing deficiencies are higher.
Fats
Fats are important for various functions of many organs. Fats can contribute around 25-50% of the calorie requirement depending on age, activity levels etc. The quality of fats need to be considered with trans fats available in ultra-processed foods being of particular concern.
Fat is an important component of diet and supports a number of functions in the body. Fat is a concentrated source of energy and per unit weight, it supplies more than twice the energy of either protein or carbohydrate. It also imparts palatability to a diet and retards the pace of emptying of the stomach. Presence of fat in the diet is important for the absorption of fat-soluble vitamins like Vitamin A and Carotene.
Packaged foods
It is recognised that access to healthy diets is challenging in low income settings, and when there is high food insecurity. Processed foods, cereals and sugars (as seen in commercially produced beverages) contribute both to under-nutrition but also to non-communicable diseases (NCDs) such as obesity, diabetes, hypertension, cardiovascular disease, cancer etc. It is therefore concerning that the report downplays this and instead makes it appear like protein from cereal has reduced while protein from other sources has gone up. Given the increased expenditure (above all other foods) towards beverages and processed foods, there would need to be more policy interventions to control this.
According to Kapoor et al. (2024), a 1 standard deviation increase from mean of diversity was associated with approximately 10% lower prevalence of anaemia in women (15-49 years). They found that the prevalence of anaemia among children (6 to 59 months) and women (15 to 49 years) is inversely associated with the dietary diversity of iron sources as measured by the Shannon Diversity Index. This relationship was observed across state/UTs and the NSS regions. They recommend that dietary diversity plays an important policy role in addressing anaemia – “an implication of this is that economic growth and development, which improve the dietary diversity of the household, could play an instrumental role in reducing the prevalence of anaemia among children and women.’ They conclude that although universal fortification in an attempt to improve iron intake and reduce anaemia in India, has widespread appeal yet it has limited impact. This echoes what doctors and several food rights groups have been saying – that fortification is not just useless, but downright harmful, and importantly that policies that promote dietary diversity at the household level, apart from general economic growth and improved access and affordability of diverse food items “through advancements in supply chain and logistics” as also “traditional practices and food habits at highly localized levels” would be better policy.
We need to also recognise that eggs are systematically denied from the mid-day meals in many states across the country. Cattle slaughter bans have made cheap nutrient dense foods inaccessible to many. So, on the one hand, the government claims to celebrate diversity while systematically erasing these, by enabling gory and macabre lynchings in the name of cow protection. The sources of micronutrients varies within states. For instance, Kerala with its acceptance of all animal source foods may have better levels of micronutrients as compared to states which are expected to make up their nutrient requirements from cereals. To meet requirements, they would have to consume increased quantities of cereals putting them at increased risk of non-communicable diseases. Children are further more likely to be stunted (and obese) if they do not have access to animal source foods. Unless these distinctions are made, a false narrative of all sources being equivalent will be created which is dangerous.
Concerns about the HCES, and some suggestions
This Household Consumption Expenditure Survey (HCES) is different in methodology (including sampling) from the earlier Household Consumer Expenditure Survey (CES) last conducted in 2011-12, and therefore the two are not comparable – so the claim that India’s poverty has declined to below 5% doesn’t hold water. Secondly, the NITI Aayog has made no effort to even determine an official poverty line or re-examine the categories of urban or rural, last defined in the Census 2001. There are concerns that there is a higher representation of well-off groups in the current sample, giving higher consumption expenditure results and an active bias that excludes poor households. Imputed cost for items received free of cost through social welfare programs were not calculated earlier, so that can also artificially hike up the current MCPE estimates.
According to the National Accounts Statistics (NAC), household consumption share is dropping since 2016 with a drop in savings and rise in debt. Questions are being raised as to how it is possible for expenditures to rise when jobs are faltering, youth unemployment is doubling or tripling and the economy is slowing down.
The HCES survey for the year 2017-18, which revealed a decline in average per capita expenditure and increase in poverty headcount ratio, was conveniently junked by the government as “unreliable”. Before that, the survey was conducted in 2011–12. Hence, no consumer expenditure data was available for over a decade to assess the impact of the economic slowdown, demonetisation, the introduction of the Goods and Services Tax (GST), Covid-19 and lockdowns etc. and how many people above the poverty line have been pushed below.
The economist S. Subramanian argues that India’s abysmally low ranking on the Global Hunger Index (GHI) which is drawn from under nutrition and <5 mortality indicators is not in keeping with what is being projected as a thriving economy.
The earlier sampling identified villages and urban blocks to select households to be surveyed. However the HCES strategy ensures that a certain proportion of the rural sample is from the villages close to the urban areas. As Anand (2024) writes –“It is safe to assume that villages closer to the city centre or the district headquarters would be relatively more affluent than the remote ones” also “While the survey design does not explicitly exclude the poorest from the sample, it reduces the probability of the poor making it to the sample”. If the extremely poor households are not a part of the sample, the monthly per capita expenditure estimates would be higher by design. Standardization of HCES across countries and better understanding of the strengths and limitations of the data are also crucial.
In the context of the food consumption survey, there are several limitations to the HCES, most notably the difficulty of estimating the intra-household allocation of foods and therefore of quantifying the actual food intake of individual household members. Research is needed to better understand the strengths and the weaknesses of HCES data when used to assess and plan intakes at the household and individual levels Dietary surveys are widely used to assess food and nutrient intakes at the population or individual level. This helps to identify nutrient gaps as well as the risks of inadequate or excessive intakes to plan programs or policies. Several methods and tools exist to assess dietary intake, but the complexity and cost of dietary surveys often discourage their widespread use in developing countries, especially on an ongoing basis. Therefore, very few countries have reliable dietary data. HCES, routinely conducted on a nationally representative sample, can be taken as proxy to plan nutrition related interventions. Whereas other methods can give individual level consumption patterns, HCES is limited to the household. Therefore, ideally, the HCES should be bolstered by other more accurate individual level data on food consumption. HCES therefore may not accurately capture individual consumption patterns due to factors like recall bias, differences in survey design across countries, and the challenges of tracking food consumed outside the home.
Standard measurements of individual consumption use the adult male as reference. For example, energy requirements of a non-pregnant or non-lactating woman is 0.8 and 0.6 for a child under five years of age. Using an estimate of the energy needs of a typical adult male (typically 3,000 kcal/day), the total household energy requirement can be estimated based on the number of Adult Male Equivalent units (AMEs) in the household. However, individual requirements can vary based on age, sex, physiological status, and (ideally) physical activity of each family member.
One method that could provide useful information is a comparison of nutritional data collected from the same household using multiple methods such as 24-hour recalls for each member of the household, as well as administering a standard HCES to determine household food consumption. Data at multiple time points to cover seasonal variations and other fluctuations in consumption would also be helpful. The more unwieldy assessments are done on smaller but representative samples.
HCES can also be difficult to compare across countries because of variations in period of recall, whether food has been collected for acquisition or consumption, mode of acquisition etc. Some of the procured foods listed in the HCES may be listed as fortified and this may or may not be factored into calculations. Further, additives, salt, sugar, trans fats etc. added to these may not be disclosed, and therefore difficult to measure or assess.
(The author is a public health doctor and researcher)
[1] Reports based on NSS (National Statistical Survey)’s 50th round (1993-94), 55th round (1999-2000), 61st round (2004-05), 66th round (2009-10) and 68th.
Related:
Poverty alleviation requires revision of Poverty Line
India behind on poverty, health and gender goals: Independent study
Why does the Karnataka government not want children to eat eggs at mid day meals?
Religious Indoctrination Through Midday Meals
Why health and sex education for young is crucial: Supreme Court